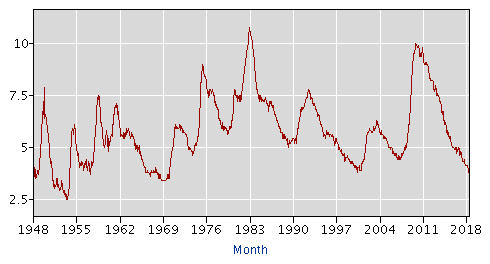
The "annual" US unemployment chart - after an 8 year hiatus
...during which time it dropped from nearly to an all-time high to the lowest rate in a generation (chart courtesy the US Bureau of Labor Statistics)
How do you think political affiliations affect personal interpretation of employment trends over the past 10 years? Do strongly held political beliefs prevent personal interpretations at all (Conformity and Group Mentality: Why We Comply)?
Do you like to attribute these numbers to presidents? congressional make-up? business-cycle? trade balances? world events?
I find it interesting to see this pop up in the news cycle occasionally and entertaining to see how different news outlets and their guests interpret it for their consumers.